Why Mother’s Day is the Ultimate Stress Test for Restaurants in 2026

Wells Fargo Restaurant Outlook: Why Mother’s Day Is the Ultimate “Stress Test” for Restaurants in 2026
Presented by Dr. Michael Swanson, Chief Agricultural Economist; Meghan Hinds, Wells Fargo Commercial Banking Franchise Finance, Division Executive.
The two busiest days of the year for the restaurant industry in the United States are Mother's Day and Valentine’s Day. Both involve showing that special someone in your life that you appreciate them and that they can relax and enjoy food without having to prepare it. Wells Fargo Credit Card Data supports that analysis. Last year’s (2025) Mother’s Day non-QSR restaurant spending showed a noticeable increase compared to other days in May. Mother’s Day credit card spend was approximately $64 at non-QSR restaurants, $17 and 36% higher than the monthly average. Many families are planning to show their appreciation again this year, so what should they and the industry expect in 2026?
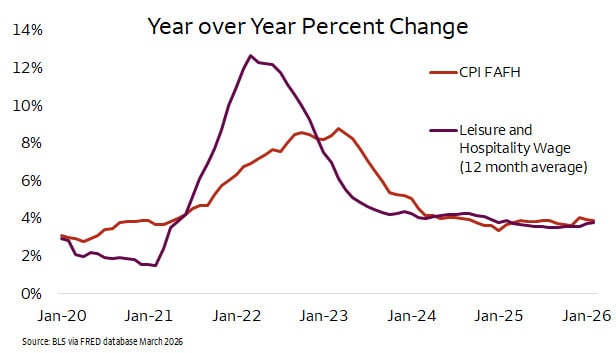
Bottom line? Expect to spend about 4% more. That would put this year’s expected Ticket Spend at $67.* The biggest driver of that increase is the labor costs for the restaurant industry. According to the USDA’s Food Dollar Series, 64% of the cost of Food Away From Home (FAFH) comes from wages and benefits. Not surprisingly, the Bureau of Labor Statistics (BLS) reported in the March report that wages have increased 3.8% for the Leisure and Hospitality category over the last 12 months. This tracks very closely with the BLS’s FAFH CPI number over the same 12 months averaging 3.9%. The following graph speaks to the Restaurant Industry’s challenges that have shaped them since the COVID event in 2020 shutdown the industry. For 2021 and 2022 and first part of 2023, they couldn’t raise menu prices fast enough to cover higher food and wage costs leading to a very difficult situation. Only since the second half of 2023 have they been able to establish parity between the wage costs and menu pricing.
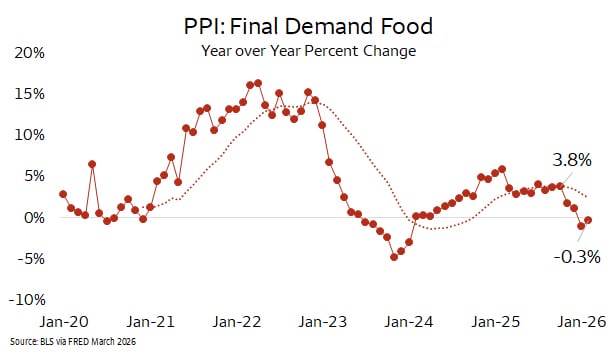
Mother’s Day menus will include foods that have become notably more expensive over the last year, as well as a few that will present savings. The Bureau of Labor Statistics (BLS) reported that the latest PPI Final Demand Food numbers from February were down 0.3% from a year ago. That has slowed considerably since its recent peak of 3.8% in October 2025, with the 12-month average trending at 2.7% for the same period. Looking at the most recent data from 2023, non-restaurant share of the Food Away From Home jumped to a recent high of 31% covering farm, food manufacturers and wholesalers and other incidentals. A couple of ingredients stand out in the 2025 cost accumulation. Two key proteins, eggs and beef saw supply problems push them to record highs; though egg prices have dropped considerably since their peak. April 2025 saw a dozen eggs averaging $5.12 at retail, but compare this to February 2026 at $2.50 a dozen. These savings should offer considerable relief to the cost of brunch items like omelets and souffles.
However, if your Mother’s Day menu features beef, you will see record high menu prices to cover the large jump in beef prices. The beef market has struggled to rebuild supply even while incentivized by record cattle prices. Additionally, the United States has turned to the global market for record beef imports to support the ground beef supply. The only thing that has gone the beef’s market favor has been the less expensive feed cost resulting from lower corn prices thanks to a record harvest in 2025. The heavier cattle weight has helped offset the lower number of cattle. However, the retail price of beef is up 17% YoY in the most recent USDA Retail Meat Price number. Restaurants that feature steaks and hamburgers have seen the most menu price pressure to manage that large increase. This might help the Average Ticket Spend, but it also pushes customers towards alternatives like chicken or pork. In contrast to beef, retail pork prices are up 1.3% in the same period, and the composite price of broilers is down 1.9%. The restaurant might be carving that prime rib thin while refilling the chicken tray more promptly.
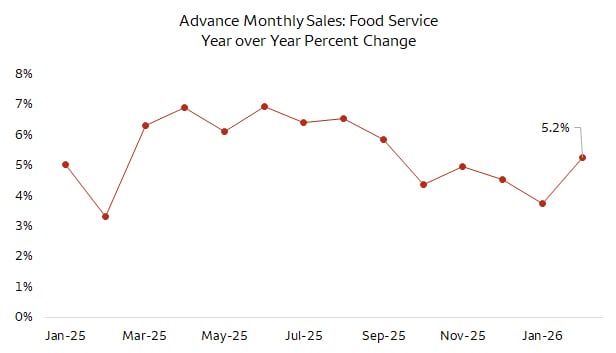
So how is the consumer responding to all this menu price inflation? The consumer has been showing resilience, but the most recent January Advance Monthly Retail sales data for food service shows a slowdown in growth to 3.9%. This just about matches the CPI price inflation for the segment implying that the underlying unit growth would be flat. For most of 2025, the rate of increase was higher than 5% which implied that there was some small underlying unit growth. With the U.S. average hourly earnings posting an estimate of $32.03 per hour in February 2026 (up 3.7% YoY), the restaurant industry continues to get its share of the consumer’s income. However, the above average recovery phase from the COVID shutdown is far behind in the industry’s review mirror. As always, the key drivers will be employment growth, wages and personal income. The Federal Reserve needs to see wage growth slow to achieve its 2.0% target. The 4th quarter of 2025 ended with the PCE Deflator increasing at 2.8%, a slight increase in the rate. This is major factor dictating the Federal Reserve’s policy actions around interest rates and money supply growth. Unfortunately, wage growth is the largest contributor to PCE inflation growth making it a target for the Federal Reserve. At the same time, payroll growth has slowed noticeably with the February 2026 number, only growing 0.1% down, from a 0.5% rate in the middle of 2025. Federal Government employment showed noticeable decline throughout the year, and more recently government shutdowns and health care strikes have negatively impacted the growth rate. This employment growth represents the largest hurdle for the Restaurant Sector as well as all consumer services.
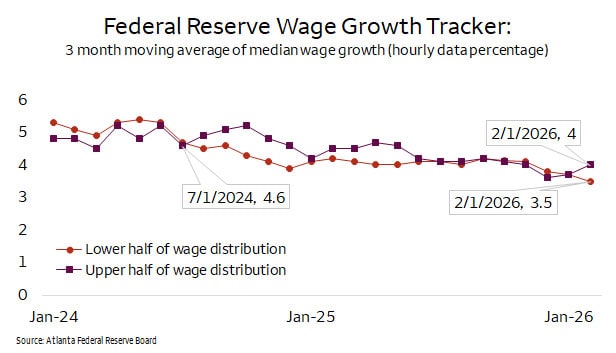
One prominent concern making its way through the industry is talk of a K-shaped recovery. Many industry participants are concerned about the consumer’s ability to dine away from home with the volatile and rapidly changing economic outlook. While the most comprehensive data from Bureau of Economic Activity is supportive of the industry, it dates back to 2024. In contrast, much of the industry cited analysis in the first quarter of 2026 is less optimistic. The best and most recent data that covers the split between wages in the different income groups can be found on the Atlanta Federal Reserve website. The following graph shows that the upper half of wage earners have grown faster than or equal to the lower half since July of 2024. Which would be supportive of the non-QSR segment in general. However, it is important to note the lower half of wage earners are growing as well. The most recent data point from the government for February 2026 showed the upper half of wage earners growing at 4% and the lower half at 3.5%. Clearly, this development continues to be front and center for the entire industry. According to Wells Fargo Division Executive, Meghan Hinds, “Restaurants will continue to focus on delivering value and differentiation to their target customer base, whether through product offering or experience – and ideally both”.
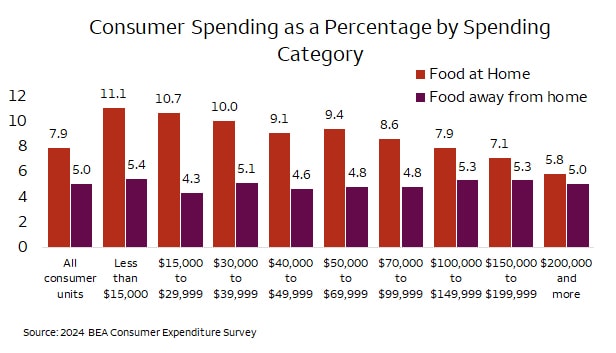
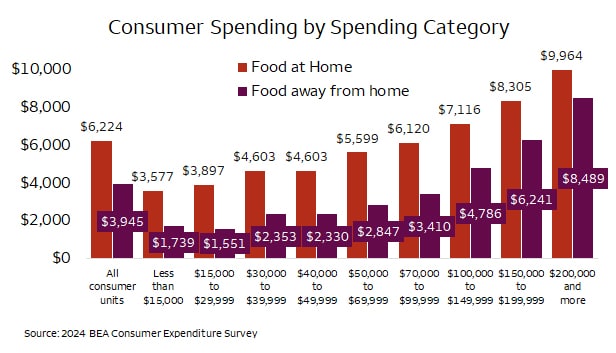
The most recent 2024 Bureau of Economic Analysis (BEA) Consumer Expenditure Survey confirms that upper and lower wage earners love restaurants equally, they just spend as their budgets allow. The following graphic shows the spending categories for Food at Home and Away as a percentage of total spending. It is surprising that the lowest category (less than $15k) spends more as a percentage than highest category ($200k). Of course, the higher income groups spend more absolute dollars than the lower income groups which makes them the key marketing demographics. That has implications for the Restaurant Segment as they track wage growth by different populations. However, it shows that options exist at all income levels. Hinds noted “Based on fierce competition for consumer dollars in the industry, restaurants are doing everything they can to drive traffic. For a holiday as popular as Mother’s Day, you can expect restaurants are hustling to attract guests and make the menu work within a variety of budgets.”

Dr. Michael Swanson, Chief Agricultural Economist

Meghan Hinds, Commercial Banking Franchise Finance, Division Executive
Michael Swanson, Ph.D. is the Chief Agricultural Economist within Wells Fargo's Agri-Food Institute. He is responsible for analyzing the impact of energy on agriculture and strategic analysis for key agricultural commodities and livestock sectors. His focus includes the systems analysis of consumer food demand and its linkage to agribusiness. Additionally, he helps develop credit and risk strategies for Wells Fargo’s customers, and performs macroeconomic and international analysis on agricultural production and agribusiness.
Michael joined Wells Fargo in 2000 as a senior economist. Prior, he worked for Land O’ Lakes and supervised a portion of the supply chain for dairy products, including scheduling the production, warehousing, and distribution of more than 400 million pounds of cheese annually, and also supervised sales forecasting. Before Land O’Lakes, Michael worked for Cargill’s Colombian subsidiary, Cargill Cafetera de Manizales S.A., with responsibility for grain imports and value-added sales to feed producers and flour millers. Michael started his career as a transportation analyst with Burlington Northern Railway.
Michael received undergraduate degrees in economics and business administration from the University of St. Thomas, and both his master’s and doctorate degrees in agricultural and applied economics from the University of Minnesota.
Meghan Hinds is the Commercial Banking Franchise Finance, Division Executive overseeing portfolios across a variety of segments including the Restaurant, Hotel, and Convenience Store lending divisions. Commercial Banking provides local coverage and specialized industry expertise to companies in a wide variety of industries and subsectors and across multiple geographic locations, as well as government, institutional, and not-for-profit clients, with loans. Commercial Banking’s relationship-focused coverage businesses provide services to companies with annual sales generally between $25 million and $2 billion, while its Specialized Industries division delivers products to companies of all sizes. In addition to traditional lending products, Commercial Banking is a market leader in asset-based lending, equipment finance and leasing, global receivables and trade finance, floor plan finance, renewable energy, and environmental finance, and provides strategic capital investments.
Based in Boston, Meghan manages a group of experienced bankers with national coverage of their respective industries. Her team is responsible for the structuring, underwriting, and monitoring of credit exposure to client relationships. Meghan is also responsible for client development and internal initiatives centered on recruiting and developing talent. She has more than 20 years of experience in banking, focused on the origination and execution of debt transactions within client coverage and capital markets platforms.
Prior to joining the Restaurant Finance Group at Wells Fargo in 2009, Meghan worked in Debt Capital Markets at Wells Fargo Securities accountable for the structuring, pricing, and distribution of debt private placements in support of the broader Commercial Banking platform. Before joining Wells Fargo, she worked in the Specialized Industries, Corporate Banking division of Bank of America as well as the High Yield Debt group at Fleet Bank in Boston.
Meghan played professional basketball in Copenhagen, Denmark. She holds a B.S. in finance, magna cum laude, from Providence College. She serves on the business advisory council board at the Providence College School of Business and is on the board of directors for H.A.L.O. (Helping Animals Living Overseas).
NRA, OpenTable, Toast: busiest & highest grossing day
Wells Fargo Credit Card Data supplied by Wells Fargo
Source: USDA ERS Food Dollar Series, Primary Factor Bill.
BLS Leisure and Hospitality CES7000000011 via FRED March 2026
BLS CUUR0000SEFV via FRED March 2026
USDA Food Dollar Series FAFH
BLS Food Cost for all Urban Consumers
BLS, Average Hourly Earnings of Production and Nonsupervisory Employees, Total Private
Atlanta Federal Reserve Wage Growth Tracker - Federal Reserve Bank of Atlanta
*Rounded to nearest dollar
The views expressed are intended for Wells Fargo customers, prospects, and other parties covering the Food and Agribusiness industry only. They present the opinions of the authors on prospective trends and related matters in food and agribusiness as of this date, and do not necessarily reflect the views of Wells Fargo & Co., its affiliates and subsidiaries. Opinions expressed are based on diverse sources that we believe to be reliable, though the information is not guaranteed and is subject to change without notice. This is not an offer to sell or the solicitation to buy Wells Fargo product or service including security or foreign exchange product.
RO- 5388302
LRC-0426
