On the line of scrimmage

On the line of scrimmage
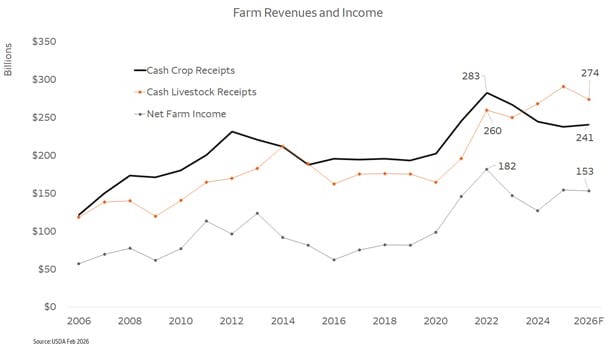
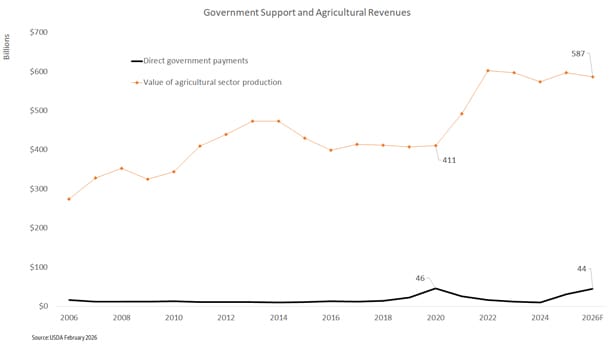
The United States Department of Agriculture (USDA) released its 2026 farm and livestock forecast for 2026 in early February. It should surprise most people how bland the forecast is for all the dire headlines about the agricultural sector. The value of agricultural production combining crops and livestock is expected to decline by 1.7%. In a commodity sector with volatile prices and volumes that amounts to no change at all. Crops remain slightly depressed thanks to the strong domestic and global production of grains and oilseeds. The crop sector should see a 1.8% decline which is in line with the general sector.
The USDA predicts livestock receipts to fall 5.4%, which is more noticeable, but this comes on the heels of last year's all-time record of $291 billion. Finally, net farm income should fall from $155 billion to $153 billion amounting to a 0.7% decline. However, underneath the top line numbers, there is a lot more action. It resembles the line of scrimmage in football which hardly moves but ultimately rules the game.
Most of the excitement on the line of scrimmage comes in the livestock stock. The biggest sector covering cattle and hogs continues to increase up 3.2% from last year’s record high. Most of that comes from the cattle sector that has been transformed in several short years. The painful drawdown of the cow/calf herd has stopped, but the expected rebound in the herd has been painfully slow with the industry in no rush to kill the goose that lays its golden eggs. On top of that, the reemergence of the New World screwworm has disrupted the importation of Mexican feeder cattle tightening an already short supply. Short supply has been no barrier to recent record domestic consumption. From 2020 to 2026, the USDA calculates that the U.S. consumer increased beef consumption by 4.3% while the calve production fell by 6.2%. This can be explained by a 63% increase in imports from many countries. Is it sustainable? Absolutely. Most of the world’s cattle herd is outside the U.S. borders producing 88% of the world’s feeder cattle. The U.S. will be importing beef for the foreseeable future.
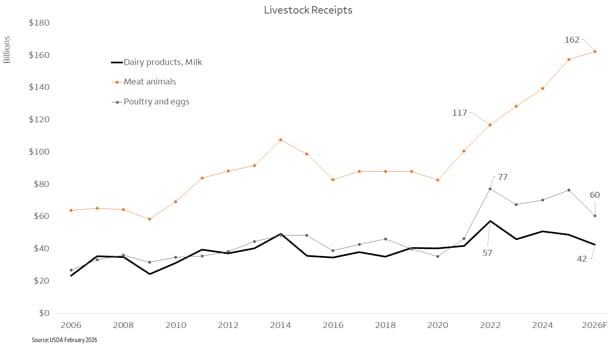
Outside of the cattle sector, the livestock sector is losing ground from its recent highs. In particular, the USDA is calling for a 21% drop in the poultry and egg sector. The USDA does not break out the broilers and the eggs directly, but most of this decline comes in the egg industry with the expectation of no repeat of the Avian Influenza. This represents a bold call since the industry has not been able to avoid a major outbreak in the last few years. Supply on a per capita basis remains tight. The U.S. consumer has completely reset their retail price perspective which could support the retail price not losing much strength.
The dairy industry continues to slide down from its banner year of 2022. The oldest joke in the commodity world applies to the dairy industry. The cure for high prices is high prices, and the cure for low prices is low prices. The all milk price to the producer peaked in May 2023 at $27.30 per hundredweight the most recent price in December 2025 was $19 per hundredweight representing a 30% drop. What in the world prompted the dairy producer to step on the gas so hard? Falling feed costs and record calf prices have proved to be an irresistible temptation. With day old calf prices reportedly in the $1,500 per calf range, they can collect approximately 79 hundredweight of milk check value from the calf. The 2025 U.S. rolling herd average was 68 lbs. of milk per day which works out to be around 116 days of milking payments. Calf production has moved from a secondary source of income straight to the top of the page.
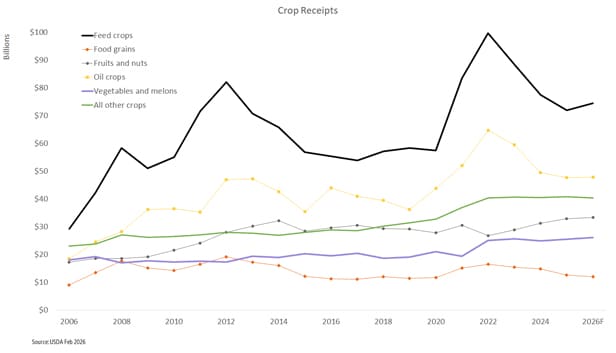
On the crop side of the equation, prices have stabilized at the new normal, which is higher than the old normal but not as good as the recent peak. This has put the farming sector back into its default mode of grinding out a victory one field at a time. The big five factors of crop production; cash rent, machinery, fertilizer, seed, and crop chemical are all struggling to find the right balance between crop prices and their values. Most of these inputs are too high, and they will need to adjust downward to leave a breakeven for the industry. They are not too far off that mark, but any downward price movements are painful for an industry that has high fixed costs. The USDA has not yet posted its expected planting acres for 2026. Corn and soybeans set a record 180 million acres planted in 2017, and that has become the new benchmark. With the exception of 2019, with millions of acres lost to preventive planting, the industry should expect farmers to plant the same number of acres with some minor adjustments to how many are corn or soybeans. This means that input sales and machinery will get their expected volume with some slightly lower prices.

Dr. Michael Swanson, Chief Agricultural Economist
Michael Swanson, Ph.D. is the Chief Agricultural Economist within Wells Fargo's Agri-Food Institute. He is responsible for analyzing the impact of energy on agriculture and strategic analysis for key agricultural commodities and livestock sectors. His focus includes the systems analysis of consumer food demand and its linkage to agribusiness. Additionally, he helps develop credit and risk strategies for Wells Fargo’s customers, and performs macroeconomic and international analysis on agricultural production and agribusiness.
Michael joined Wells Fargo in 2000 as a senior economist. Prior, he worked for Land O’ Lakes and supervised a portion of the supply chain for dairy products, including scheduling the production, warehousing, and distribution of more than 400 million pounds of cheese annually, and also supervised sales forecasting. Before Land O’Lakes, Michael worked for Cargill’s Colombian subsidiary, Cargill Cafetera de Manizales S.A., with responsibility for grain imports and value-added sales to feed producers and flour millers. Michael started his career as a transportation analyst with Burlington Northern Railway.
Michael received undergraduate degrees in economics and business administration from the University of St. Thomas, and both his master’s and doctorate degrees in agricultural and applied economics from the University of Minnesota.
USDA February 2026
The views expressed are intended for Wells Fargo customers, prospects, and other parties covering the Food and Agribusiness industry only. They present the opinions of the authors on prospective trends and related matters in food and agribusiness as of this date, and do not necessarily reflect the views of Wells Fargo & Co., its affiliates and subsidiaries. Opinions expressed are based on diverse sources that we believe to be reliable, though the information is not guaranteed and is subject to change without notice. This is not an offer to sell or the solicitation to buy Wells Fargo product or service including security or foreign exchange product.
RO-5257393
LRC-0326
