By Michael Swanson, Ph.D., Chief Agricultural Economist, Wells Fargo Agri-Food Institute
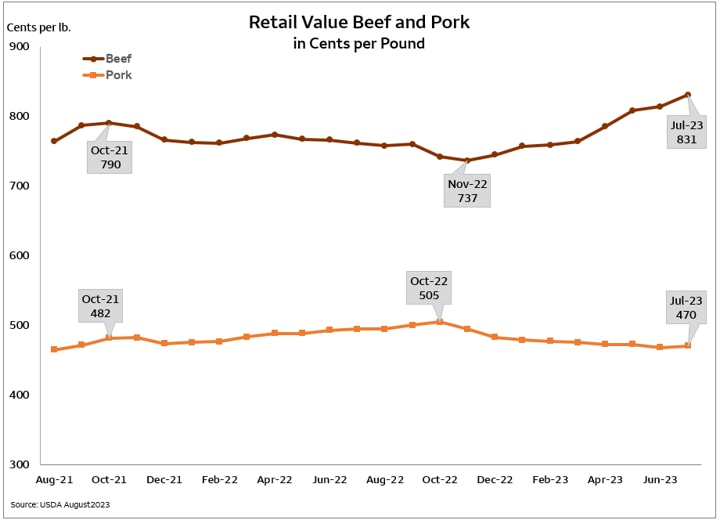
 The August 2023 Bureau of Labor Statistics (BLS) release saw retail beef prices hit yet another record high at $8.31 per pound. In contrast, pork and chicken prices have moved sidewise or even fallen. The market is trying to limit both domestic and exported beef demand through higher prices.
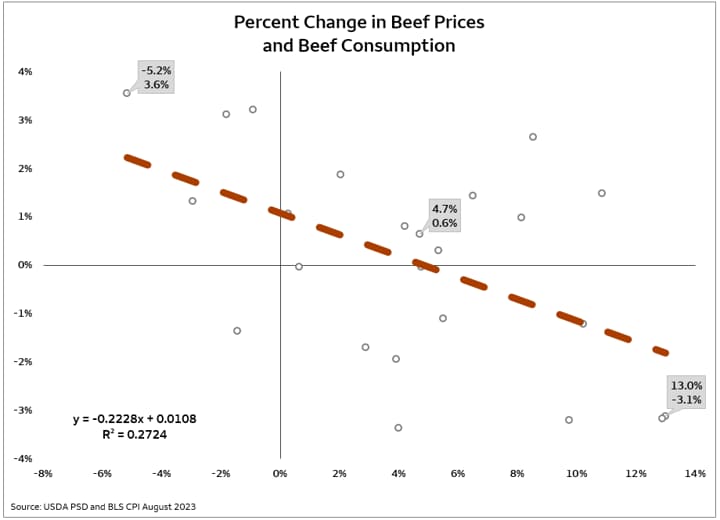
Analysts often debate about the price elasticity of a product like beef, but sometimes, don’t explain what they’re trying to estimate, and the limits of a product’s usefulness. Beef, like most food items, is price inelastic meaning the price moves more than the demand. According to the USDA’s data, retail beef prices rose by 4.7% from 2021 to 2022, and at the same time, domestic beef consumption rose by 0.6%. So, with price elasticity being the ratio of percent change in quantity demand divided by the percent change in price, the math would tell you that beef’s price elasticity is 0.13, which implies that raising prices increases demand. Of course, saying that raising beef prices increases demand qualifies as an economic joke for the unaware.

Looking back to 2000, the following chart plots the percent change in domestic disappearance (y-axis) versus the percent change in retail beef prices (x-axis) on an annual basis. A careful look will avoid a lot of misunderstanding. First, one data point doesn’t tell you much. In 2021, beef prices rose by 10% and beef consumption rose by 3%. In contrast, in 2011, beef prices rose by 10% and beef consumption fell by 3%. So, obviously, there are more things going on than just price changes. Second, the demand line slopes negatively. So yes, raising prices decreases demand more often than not. Lastly, the change in price doesn’t explain much of the relationship by itself. It actually explains about one quarter of the demand variability. That means you are still guessing about the other three quarters of the response.
What else should one consider? Other factors that would need to be included are income changes, food item substitutes and their prices, and lastly, export markets. In reality, an expensive and extensive econometric study would still leave you guessing about the impact of price changes on demand.

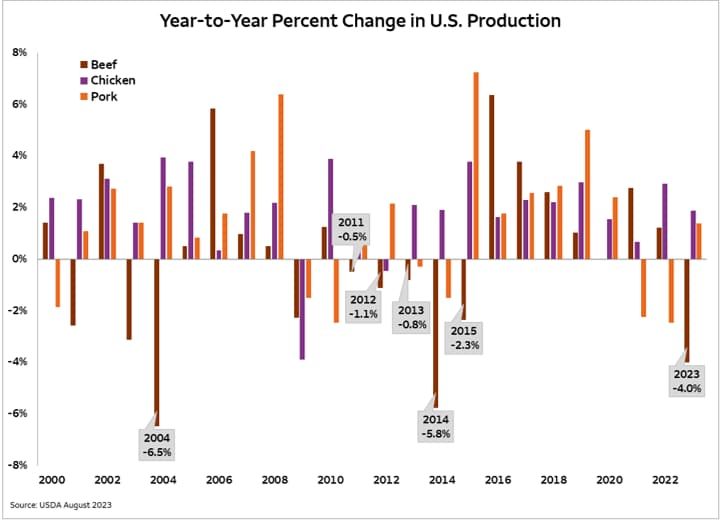
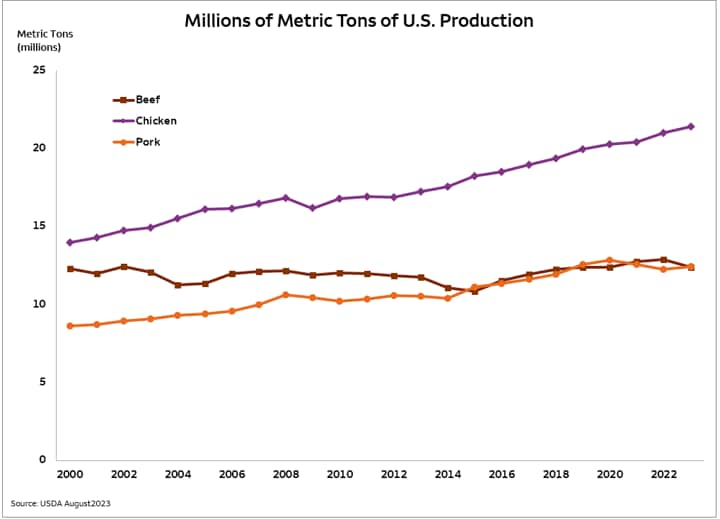
The USDA’s World Agricultural Supply and Demand Estimates (WASDE) report shows domestic beef production down 4% from 2022. How long does the rebuilding cycle for beef last? Looking at the historical movements, 2014 showed a 5.8% decline in beef production, and was followed by a 2.3% decline in 2015. However, those two big declines were preceded by three years of minor reductions in domestic production totaling five years of production decline. Unlike chicken and pork producers who can change flocks and herds within months, cattle producers require years to change the herd size. Additionally, cow/calf operators are at the mercy of the weather for grazing production. The most recent drought monitoring maps from the USDA show significant improvement for much of the key grazing areas of the U.S. compared to a year ago, but across a multi-year cycle, which is sure to change. Regardless of the grazing conditions, the cow/calf operators are getting a strong price signal to expand production through retaining heifers.

Once again, it is best not to chase false precision through a modeling exercise. Let’s look at the facts. Record-high retail beef prices will support cashflow throughout the entire cattle supply chain. It will be a battle to see who gets to maintain their margins at the expense of others, but there will be enough money to support the entire industry. Though wage increases, the consumer has relatively good purchasing power for all of the different proteins. Beef is only slightly more expensive in terms of its historically wage-adjusted prices. So, lower prices for poultry and pork will have a limited negative impact on beef demand. The previous rebuilding cycle ran for five years, starting slowly, and finishing with two large year-on-year contractions. This current cycle looks like it will start with a larger contraction and finish with smaller adjustments in the later years. And, it is unlikely that this cycle will last only two years. A better bet historically calls for a three to five-year cycle. The length of the cycle is one thing to guess at econometrically, but each year will be a different story within that cycle. The market will find plenty of opportunity as the cycle plays out to make adjustments and tell new stories.

 Michael Swanson, Ph.D. is the Chief Agricultural Economist within Wells Fargo's Agri-Food Institute. He is responsible for analyzing the impact of energy on agriculture and strategic analysis for key agricultural commodities and livestock sectors. His focus includes the systems analysis of consumer food demand and its linkage to agribusiness. Additionally, he helps develop credit and risk strategies for Wells Fargo’s customers, and performs macroeconomic and international analysis on agricultural production and agribusiness.
Michael joined Wells Fargo in 2000 as a senior economist. Prior, he worked for Land O’ Lakes and supervised a portion of the supply chain for dairy products, including scheduling the production, warehousing, and distribution of more than 400 million pounds of cheese annually, and also supervised sales forecasting. Before Land O’Lakes, Michael worked for Cargill’s Colombian subsidiary, Cargill Cafetera de Manizales S.A., with responsibility for grain imports and value-added sales to feed producers and flour millers. Michael started his career as a transportation analyst with Burlington Northern Railway.
Michael received undergraduate degrees in economics and business administration from the University of St. Thomas, and both his master’s and doctorate degrees in agricultural and applied economics from the University of Minnesota.

 Sign On